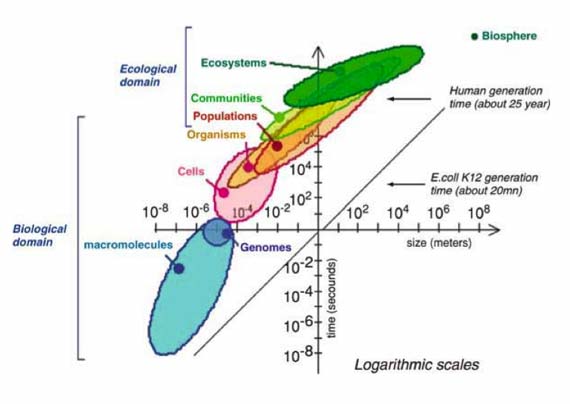
One thing I’m grappling with these days is how to graphically portray scale and time. It’s a gnarly problem. Here, Alain Pavé shows overlapping scales of interactions for entities ranging from teeny things smaller than genomes to ecosystems and biospheres, all wrapped up in a single package, that at least on first blush, looks accurate. (Just how small are the smallest organisms anyway?)
Obviously, using two axes is an obvious solution (time on y and scale on x). I’m pondering adding a z axis, with a third variable (e.g., another kind of scale, for example size in extent—hectares—vs population). Hurts my head to try and actually generate that figure, however.
Fortunately, my bright, wise hubby, the Genius Wizard, has just purchased the latest Edward Tufte, so a guide is at hand….
* Pavé, Alain. 2006. “Biological and Ecological Systems Hierarchical Organization,” in Hierarchy in Natural and Social Sciences. Edited by Denise Pumain, pp. 39–70. Dordrecht: Springer. Figure 2, page 48.