Time lines
Saturday, 11 March 2006
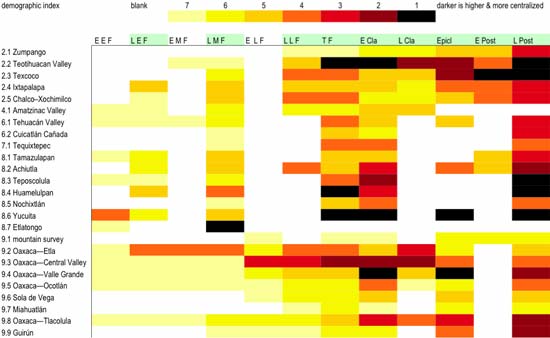
I’m guessing this doesn’t make much sense, but it’s what I’ve been working on for the last few days, and need to tweak a bit more.
The short version is that time goes from left to right (right is most recent), and white means I have no (comparable) data. I’m trying to generate an index of demographic centralization using regional survey data, and this is how far I’ve gotten. The darkest colors had the most centralized populations (more people lived in large communities). Stand by for adjustments.